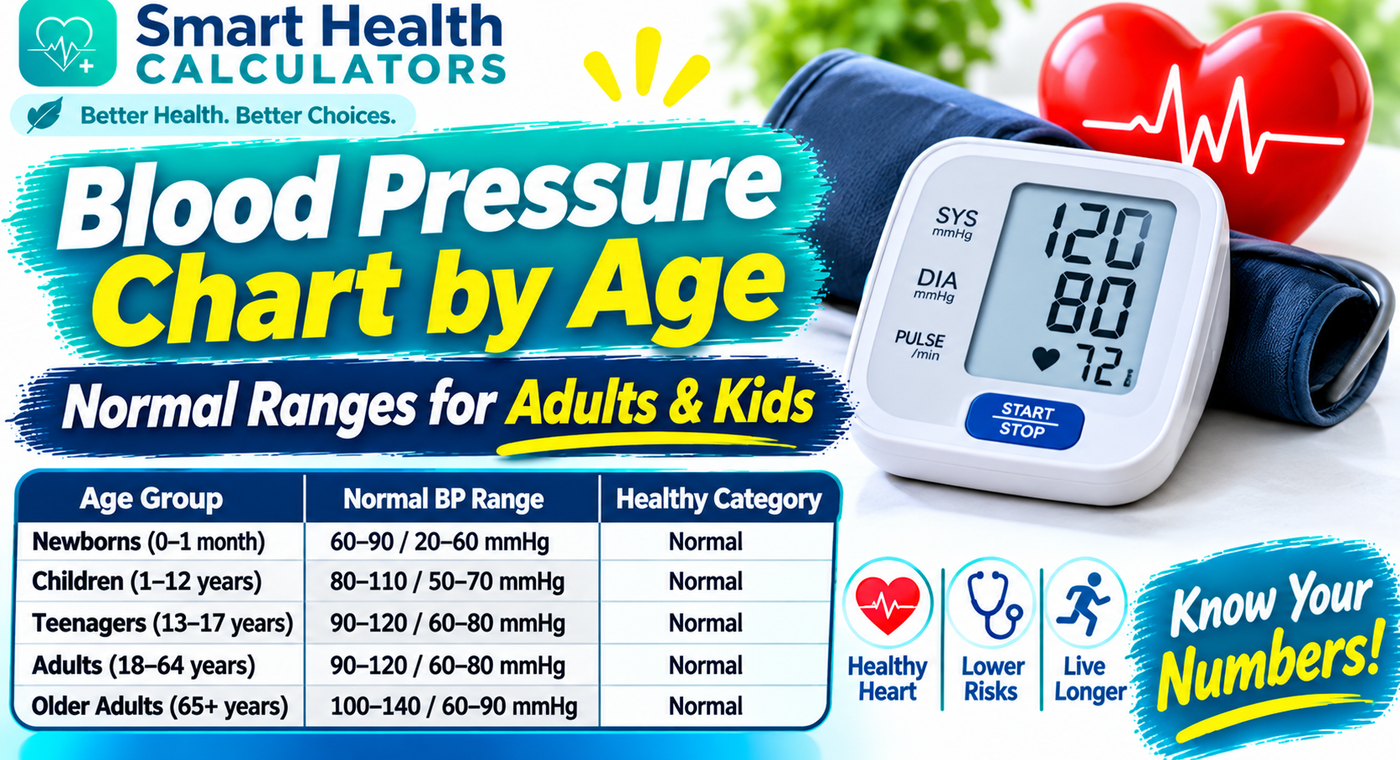
Blood Pressure Chart by Age: Normal Ranges for Adults & Kids
Blood pressure chart by age for adults, seniors and kids. See normal, elevated and high BP ranges, what the numbers mean and when to call a doctor.
You get a reading of 128/82 at a pharmacy kiosk. Is that fine for your age, or should you worry? Most people search for a blood pressure chart by age hoping for one clean number per decade of life.
The honest answer is a little different, and it is more useful. Adults of every age are sorted into the same four categories. For children, the question changes completely. This guide shows you the chart, explains how to read it, and covers why numbers drift upward as we age. It also tells you when a reading deserves a call to your doctor.
Medical information last verified: November 17, 2026. This article is educational and does not replace advice from a qualified clinician.
What Is Normal Blood Pressure by Age?
For adults aged 18 and older, normal blood pressure is below 120/80 mmHg, according to the 2025 AHA/ACC guideline. That threshold applies whether you are 25 or 75. The guideline does not set a separate "normal" range for each decade.
Blood pressure does tend to rise with age, so many older adults land in the elevated or high categories. For children and teens under 13, doctors compare readings with percentiles based on age, sex and height, not with the adult chart.
Blood Pressure Chart for Adults (Ages 18 and Older)
This is the reference table most clinicians use today. It follows the 2025 AHA/ACC adult guideline, which kept the same category cutoffs as the 2017 version.
| Category | Systolic (top number) | Diastolic (bottom number) |
|---|---|---|
| Normal | Below 120 | Below 80 |
| Elevated | 120–129 | Below 80 |
| Stage 1 hypertension | 130–139 | 80–89 |
| Stage 2 hypertension | 140 or higher | 90 or higher |
| Hypertensive crisis (seek care) | Above 180 | Above 120 |
How to use this table: If your two numbers fall into different categories, you go by the higher one. A reading of 118/85 is stage 1, because the diastolic number sets the category. A reading of 135/70 is also stage 1, because the systolic number does.
One reading never diagnoses high blood pressure. The guideline bases a diagnosis on the average of at least two careful readings taken on at least two occasions. A single spike after coffee, a rushed walk or a stressful commute can mislead you.
The same chart in plain language
- Normal: Keep doing what you are doing and recheck at least yearly.
- Elevated: Not yet hypertension, but a warning sign. Lifestyle changes matter most here.
- Stage 1: Your doctor will confirm it with repeat readings and look at your overall heart risk before deciding on treatment.
- Stage 2: Usually needs medical treatment alongside lifestyle changes.
- Crisis range: Repeat the reading after a minute or two of rest. If it stays this high, call a healthcare professional promptly. If you also have chest pain, shortness of breath, weakness, vision changes or trouble speaking, call emergency services.
Why There Is No Separate Normal Range for Every Age
Search results are full of charts that list a different "normal" for 20-year-olds, 40-year-olds and 60-year-olds. Many of those charts blend population averages with clinical targets, and the two are not the same thing.
An average tells you what typical people have. Averages rise with age because arteries stiffen. A category tells you how much cardiovascular risk a reading carries. Risk climbs steadily as blood pressure rises above 120/80, and that is true at 30 and at 70.
So a 70-year-old with 150/90 is not "normal for their age." They are in stage 2 hypertension. The number may be common in their age group, but common is not the same as healthy.
This is why we built the chart above around categories. It is also why your own treatment target depends on your health history, not only on your birthday. For most adults the overall goal is below 130/80, but a clinician may adjust it if you are frail, pregnant, living in long-term care or managing other conditions.
How Blood Pressure Changes Across Adult Life
Even though the categories stay the same, what you are likely to see on your monitor shifts over the decades. Here is the general pattern.
In your 20s and 30s
Most young adults sit in the normal range, but not all. Excess weight, high salt intake, heavy alcohol use, poor sleep and family history can push readings up early. Young adults are also the group least likely to check, which means high blood pressure can go unnoticed for years.
If your pressure is borderline in these years, habits make a huge difference. Our guide on how to lower blood pressure naturally is a good starting point.
In your 40s and 50s
Systolic pressure often begins to climb. Weight gain around the middle, stress, less sleep and reduced activity all contribute. Many people receive their first stage 1 reading in this window, often at a routine checkup or workplace screening.
This is also when sleep apnea quietly raises pressure in some people. If you snore loudly, wake up tired and have stubborn high readings, raise it with your doctor.
In your 60s and beyond
Arteries lose some of their elasticity. The top (systolic) number tends to rise while the bottom (diastolic) number stays flat or even falls. That pattern is called isolated systolic hypertension, and it is the most common form of high blood pressure in older adults.
Older adults also face a different risk on the other side. Standing up too fast can cause a sudden drop called orthostatic hypotension, which leads to dizziness and falls. If this sounds familiar, read our guide on what to do when blood pressure drops.
A practical example
Consider a hypothetical 62-year-old woman. Her home readings average 136/78 over two weeks. She falls in stage 1 because her systolic number is between 130 and 139. She does not have diabetes or kidney disease, so her doctor may suggest several months of lifestyle changes first, then recheck. If she did have diabetes, the conversation about medication might start sooner.
The number alone never tells the whole story. Context decides the plan.
Blood Pressure Chart for Men vs Women
Many people want a separate chart for each sex. The adult categories are the same for both. Still, there are real differences in how blood pressure behaves.
- Before menopause, women on average have lower blood pressure than men of the same age.
- After menopause, women's blood pressure often rises and the gap narrows. Hormonal changes, weight shifts and changes in vascular health all play a role.
- Pregnancy brings its own rules. High blood pressure can develop during or after pregnancy, including preeclampsia, and the 2025 guideline introduced pregnancy-specific categories. If you are expecting, follow your obstetric team's targets and read our guide on staying healthy during pregnancy.
- Men are more likely to be diagnosed with hypertension earlier in life, partly because they check less often and carry more risk factors such as abdominal fat.
The takeaway: use the same adult categories, but pay attention to life stages that change your risk.
Blood Pressure Chart for Children and Teens
Here is where many online charts go wrong. They show adult numbers next to a child's age. That does not work, because children's blood pressure depends on age, sex and height.
Under the American Academy of Pediatrics 2017 guideline, the approach has two parts.
Children aged 1 to 12
Doctors compare the reading to percentile tables for the child's age, sex and height.
| Category | Rule of thumb |
|---|---|
| Normal | Below the 90th percentile |
| Elevated | 90th percentile to below the 95th (or 120/80 up to the 95th, whichever is lower) |
| Stage 1 hypertension | 95th percentile up to 12 mmHg above it (or 130/80 to 139/89, whichever is lower) |
| Stage 2 hypertension | More than 12 mmHg above the 95th percentile (or 140/90 or higher) |
Teens aged 13 and older
Thresholds line up closely with the adult categories: normal below 120/80, elevated 120/<80 to 129/<80, stage 1 at 130/80 to 139/89, and stage 2 at 140/90 or higher.
What parents should do
You cannot judge a child's reading from a general chart. Ask your pediatrician to interpret it using the right percentile tables, and make sure the cuff size fits the child's arm. A cuff that is too small gives falsely high numbers.
For official background, see the NHLBI high blood pressure overview.
Systolic vs Diastolic: What the Two Numbers Mean
Every reading has two numbers, written like a fraction.
- Systolic (top number): The pressure in your arteries when your heart contracts and pushes blood out.
- Diastolic (bottom number): The pressure in your arteries when your heart relaxes between beats.
Think of a garden hose. Systolic pressure is the surge when the tap opens fully. Diastolic pressure is the steady pressure left in the hose when the surge pauses.
When only one number is high
- High top, normal bottom: This is isolated systolic hypertension. It is common after age 60 because stiff arteries cannot cushion each heartbeat.
- Normal top, high bottom: This is isolated diastolic hypertension. It is more common in younger adults and is often linked to weight, alcohol and stress.
Both count. You are classified by whichever number is higher on the chart.
Pulse pressure and heart rate
The gap between the two numbers is called pulse pressure. A wide gap in older adults can signal stiff arteries. Blood pressure is also separate from your pulse. Heart rate counts beats per minute, while blood pressure measures force. For pulse benchmarks, see our guide to normal heart rate by age.
What Counts as Low Blood Pressure?
Unlike high blood pressure, low blood pressure has no single official cutoff. Many clinicians start paying attention below roughly 90/60 mmHg, but symptoms matter more than the number. Some healthy, fit people live comfortably at 95/60 with no problems.
Common symptoms of low blood pressure:
- Dizziness or lightheadedness, especially on standing
- Blurred vision
- Fainting
- Unusual fatigue
- Nausea
- Cold, clammy skin
Common triggers: dehydration, long periods in heat, blood loss, certain medications, pregnancy, heart rhythm problems and infections.
If you feel faint or confused, sit or lie down and seek care. A sudden drop with chest pain or severe weakness is an emergency. Learn more in our guide to low blood pressure symptoms, causes and treatment.
How to Measure Blood Pressure at Home Correctly
The chart is only as good as your reading. Poor technique can add 10 mmHg or more to a result.
Before you measure
- Avoid caffeine, exercise and smoking for 30 minutes.
- Empty your bladder.
- Sit quietly for five minutes.
During the measurement
- Sit in a chair with your back supported and feet flat on the floor.
- Rest your arm on a table at heart level.
- Place the cuff on bare skin, not over clothing.
- Do not talk or cross your legs.
- Take two readings one minute apart and note both.
Tips that improve accuracy
- Use an upper-arm monitor. Wrist devices are more sensitive to positioning.
- Check the cuff size. Too small reads high, too large reads low.
- Measure at consistent times, for example morning and evening, for a week before a doctor visit.
- Write everything down. A log is far more useful than a single remembered number.
The American Heart Association offers a clear overview of reading your results.
White coat and masked hypertension
Some people have normal readings at home but high readings at the clinic. That is white coat hypertension. The reverse also happens: normal in the office but high at home, called masked hypertension. Home monitoring and 24-hour ambulatory monitoring help sort this out.
Why Does Blood Pressure Rise With Age?
Several changes work together.
Arterial stiffness. Young arteries stretch with every heartbeat. Over time, collagen builds up and elastic fibers wear down. Stiffer vessels push systolic pressure higher.
Plaque and narrowing. Atherosclerosis, the buildup of fatty deposits, can narrow arteries and raise resistance to blood flow.
Kidney changes. Kidneys help regulate salt and fluid. As filtering capacity declines with age, the body may hold on to more sodium.
Lifestyle accumulation. Years of sitting, weight gain, high-sodium meals and chronic stress add up.
Hormonal shifts. Menopause and changes in testosterone can alter vascular tone.
The good news is that stiffness is not entirely fixed. Regular activity, weight management and a heart-healthy diet can slow it.
Habits That Help Keep Your Numbers in a Healthy Range
The 2025 guideline places lifestyle change as the first line of defense for everyone. For people with excess weight, losing even 5% of body weight can help lower or prevent high blood pressure. Here are the habits with the strongest evidence behind them.
Eat in a pattern that supports your arteries
The DASH diet is built around vegetables, fruit, whole grains, low-fat dairy, nuts and lean protein, with less sodium and saturated fat. Boosting potassium-rich foods and cutting back on ultra-processed food helps in practice. Adding high-fiber foods is an easy step, and our list of the best drinks for heart health shows what to sip. If you want a structured plan, try the Diet Plan Generator.
Move more, in ways you will keep doing
Aim for regular moderate activity such as brisk walking. Our guide to how many steps per day helps you set a realistic target, and the Step Counter Goal Planner turns it into a daily plan. To train at the right intensity, use the heart rate zone calculator guide.
Manage weight sensibly
Check where you stand with the BMI Calculator, then read about its limits in is BMI accurate. Waist size can add helpful context, which we explain in waist-to-height ratio. For practical fat-loss steps, see our weight loss strategies.
Protect your sleep
Short or broken sleep keeps stress hormones high and nudges blood pressure up. Use the Sleep Quality Checker and follow our sleep hygiene tips.
Lower stress in small, repeatable ways
Stress reduction is a useful add-on, not a replacement for treatment. Try the six relaxation techniques to reduce stress or our natural ways to reduce stress. The Mental Health Checker can help you spot patterns.
Limit alcohol and stay hydrated
Reducing or eliminating alcohol is strongly recommended in the guideline. Staying hydrated also supports steady circulation, and the Water Intake Calculator gives you a personal target.
Blood Pressure and Your Overall Health Age
Blood pressure is one of the clearest signals of how your cardiovascular system is aging. Two people of the same calendar age can have very different arterial health. That is why we encourage you to look beyond a single reading.
Try the Health Age Calculator to see how your habits compare with your birthday age, then read our guide on how to lower biological age for practical next steps.
When to Talk to a Doctor
Do not rely on a chart alone for decisions about medication or symptoms. Contact a healthcare professional if:
- Your home average is 130/80 or higher across multiple days
- You have repeated readings of 140/90 or higher
- Your readings are consistently below 90/60 and you feel unwell
- You have a family history of heart disease, stroke, diabetes or kidney disease
- You are pregnant and notice rising readings, headaches or swelling
- You start a new medication and your numbers change sharply
Seek emergency care immediately if
Your reading is above 180/120 and you have chest pain, shortness of breath, severe headache, weakness, vision changes or trouble speaking. Do not wait to see if it settles.
For symptom detail, read our guide to high blood pressure symptoms, causes and treatment. Many people with high blood pressure feel nothing at all, which is why regular checks matter.
How Guidelines Differ Around the World
Not every country uses the same cutoffs. The US guideline labels 130/80 as stage 1 hypertension. Many other systems, including the European approach, define hypertension at 140/90 in the office and treat the 120–139 range as "elevated" with different targets. The UK's NICE guideline NG136 also uses a 140/90 clinic threshold and confirms diagnosis with home or ambulatory monitoring.
The World Health Organization provides global data on prevalence and treatment, and the CDC covers US statistics and prevention.
What this means for you: The chart in this article follows US guidance. If you live elsewhere, your doctor may use slightly different thresholds. Follow their advice, because they know your health history and local standards.
Why Choose Smart Health Calculators
If you are wondering why choose Smart Health Calculators, here is the short version. We pair free tools with plain-language guides, we cite recognized medical sources, and we keep our explanations separate from medical advice. You can read our disclaimer and contact us with questions.
Ready to go further? Explore advanced tools at Smart Health Calculators for calculators covering BMI, calories, hydration, sleep, workouts and more. You can also book a seat at Advance Free Tools offered by Smart Health Calculators to get the most from the full suite.
Frequently Asked Questions
What is the normal blood pressure for a 30-year-old woman?
A normal reading for an adult woman of any age, including 30, is below 120/80 mmHg. Pregnancy, hormonal contraception and certain medications can change readings, so talk to your doctor if your numbers are consistently higher.
What should blood pressure be at age 60?
The adult categories do not change at 60. Normal is still below 120/80, and most guidelines aim for under 130/80 for treatment. Many people in their 60s have higher readings because of arterial stiffness, but higher is not the same as healthy.
Is 130/80 considered high blood pressure?
Under the 2025 AHA/ACC guideline, 130/80 is stage 1 hypertension. Other guidelines, such as those used in parts of Europe and the UK, classify hypertension from 140/90, so the label can vary by country. A diagnosis still needs repeat measurements.
Is 140/90 dangerous for a 70-year-old?
A reading of 140/90 falls in stage 2 hypertension on the AHA/ACC chart for adults of any age. It is not an emergency on its own, but it needs medical attention and a treatment plan. Your doctor will consider your overall health, medications and fall risk.
Does blood pressure naturally increase with age?
Yes, on average, mostly because arteries stiffen over time. That increase raises cardiovascular risk, so it should not be dismissed as normal aging. Healthy habits can slow the trend.
What is the normal blood pressure for children?
Children aged 1 to 12 are assessed using age, sex and height percentiles, with normal defined as below the 90th percentile. Teens 13 and older use thresholds close to the adult categories. Always have a pediatrician interpret a child's reading.
What blood pressure is considered an emergency?
A reading above 180 systolic and/or above 120 diastolic needs a repeat measurement after a minute or two. If it stays that high, contact a healthcare professional promptly. If you have symptoms such as chest pain, breathlessness, weakness, vision changes or trouble speaking, call emergency services.
Is low blood pressure dangerous?
Not always. Many healthy people run low with no symptoms. It becomes a concern when it causes dizziness, fainting, confusion or fatigue, or when it drops suddenly.
Key Takeaways and Your Next Step
- Adult categories are the same at every age: normal is below 120/80, elevated is 120–129 over below 80, stage 1 is 130–139 or 80–89, and stage 2 is 140/90 or higher.
- Averages rise with age, but a "common for my age" reading can still carry real risk.
- Children and teens under 13 need percentile-based interpretation, not an adult chart.
- One reading is not a diagnosis. Averages from careful, repeated measurements are.
- Lifestyle changes are the first line of defense for everyone, and they work at any age.
Your next step: Take two readings tomorrow morning using the technique above, then repeat for seven days and write the numbers down. Bring that log to your next appointment. While you are at it, check your overall picture with the Health Age Calculator.
Medical Disclaimer
This article is for general education only. It is not medical advice, diagnosis, treatment, prescription guidance, or a replacement for professional healthcare. Speak with a qualified healthcare professional for personal medical concerns, symptoms, pregnancy concerns, mental health crisis, medication questions, or before making major health changes.